Offloading the heavy lifting to Grafana Cloud
 By Robin Dowling · 22 days ago
The simulation's metrics started as terminal logging. In the early days, the only way to know if life was emerging - if organisms were actually surviving, reproducing, and forming species - was to watch numbers scroll past in stdout. Birth counts, death counts, population totals, energy budgets. It was primitive, but it was enough to detect whether the world was alive or collapsing.
As the simulation grew more complex, so did the need to understand it. Terminal output became a custom metrics aggregation engine: a stats tracker built on HashMaps behind a Mutex, updated from the simulation's main loop every tick. The server serialized the current values into a compact format and broadcast them over a dedicated WebSocket channel to every connected browser client. The home page ticker, the in-simulation stats overlays - everything consumed this same feed. It tracked ~30 stats and it worked well. I always knew what was happening in every world.
But the engine had outgrown the server. The simulation was doing double duty: running the world and aggregating, serializing, and distributing all the stats data to every connected client. That's a lot of compute for a machine whose primary job is simulating evolution. The metrics were solid; they just needed to run somewhere else.
So I kept the same data but moved the heavy lifting. The stats pipeline is now Prometheus metrics scraped by Grafana Cloud.
How it grew
The progression was natural. Terminal logging told me whether life existed. The custom engine told me what was happening in detail. But both ran inside the simulation process, competing for the same CPU cycles. Adding a new metric meant touching the tracker, the serializer, and the client deserializer. There was no retention beyond the current moment - spawn a new world and the data was gone. There was no way to query historical trends or build visualizations beyond what the client hard-coded. The system was good at what it did, but it was doing it in the wrong place.
Prometheus on the server
The replacement writes metrics directly from the simulation engine using the prometheus crate's GaugeVec and CounterVec types. Point-in-time state - alive organisms, species counts, energy levels - uses gauges. Monotonically increasing events - births, deaths, user interactions - use counters. Every metric write is lock-free (AtomicF64 under the hood), so the simulation loop pays almost nothing for instrumentation.
A new api endpoint exposes the metrics in Prometheus text format. The endpoint is gated behind a TTL that matches the scrape interval, so the gauge-collection logic only runs as often as Grafana actually asks for data.
Grafana Cloud dashboards
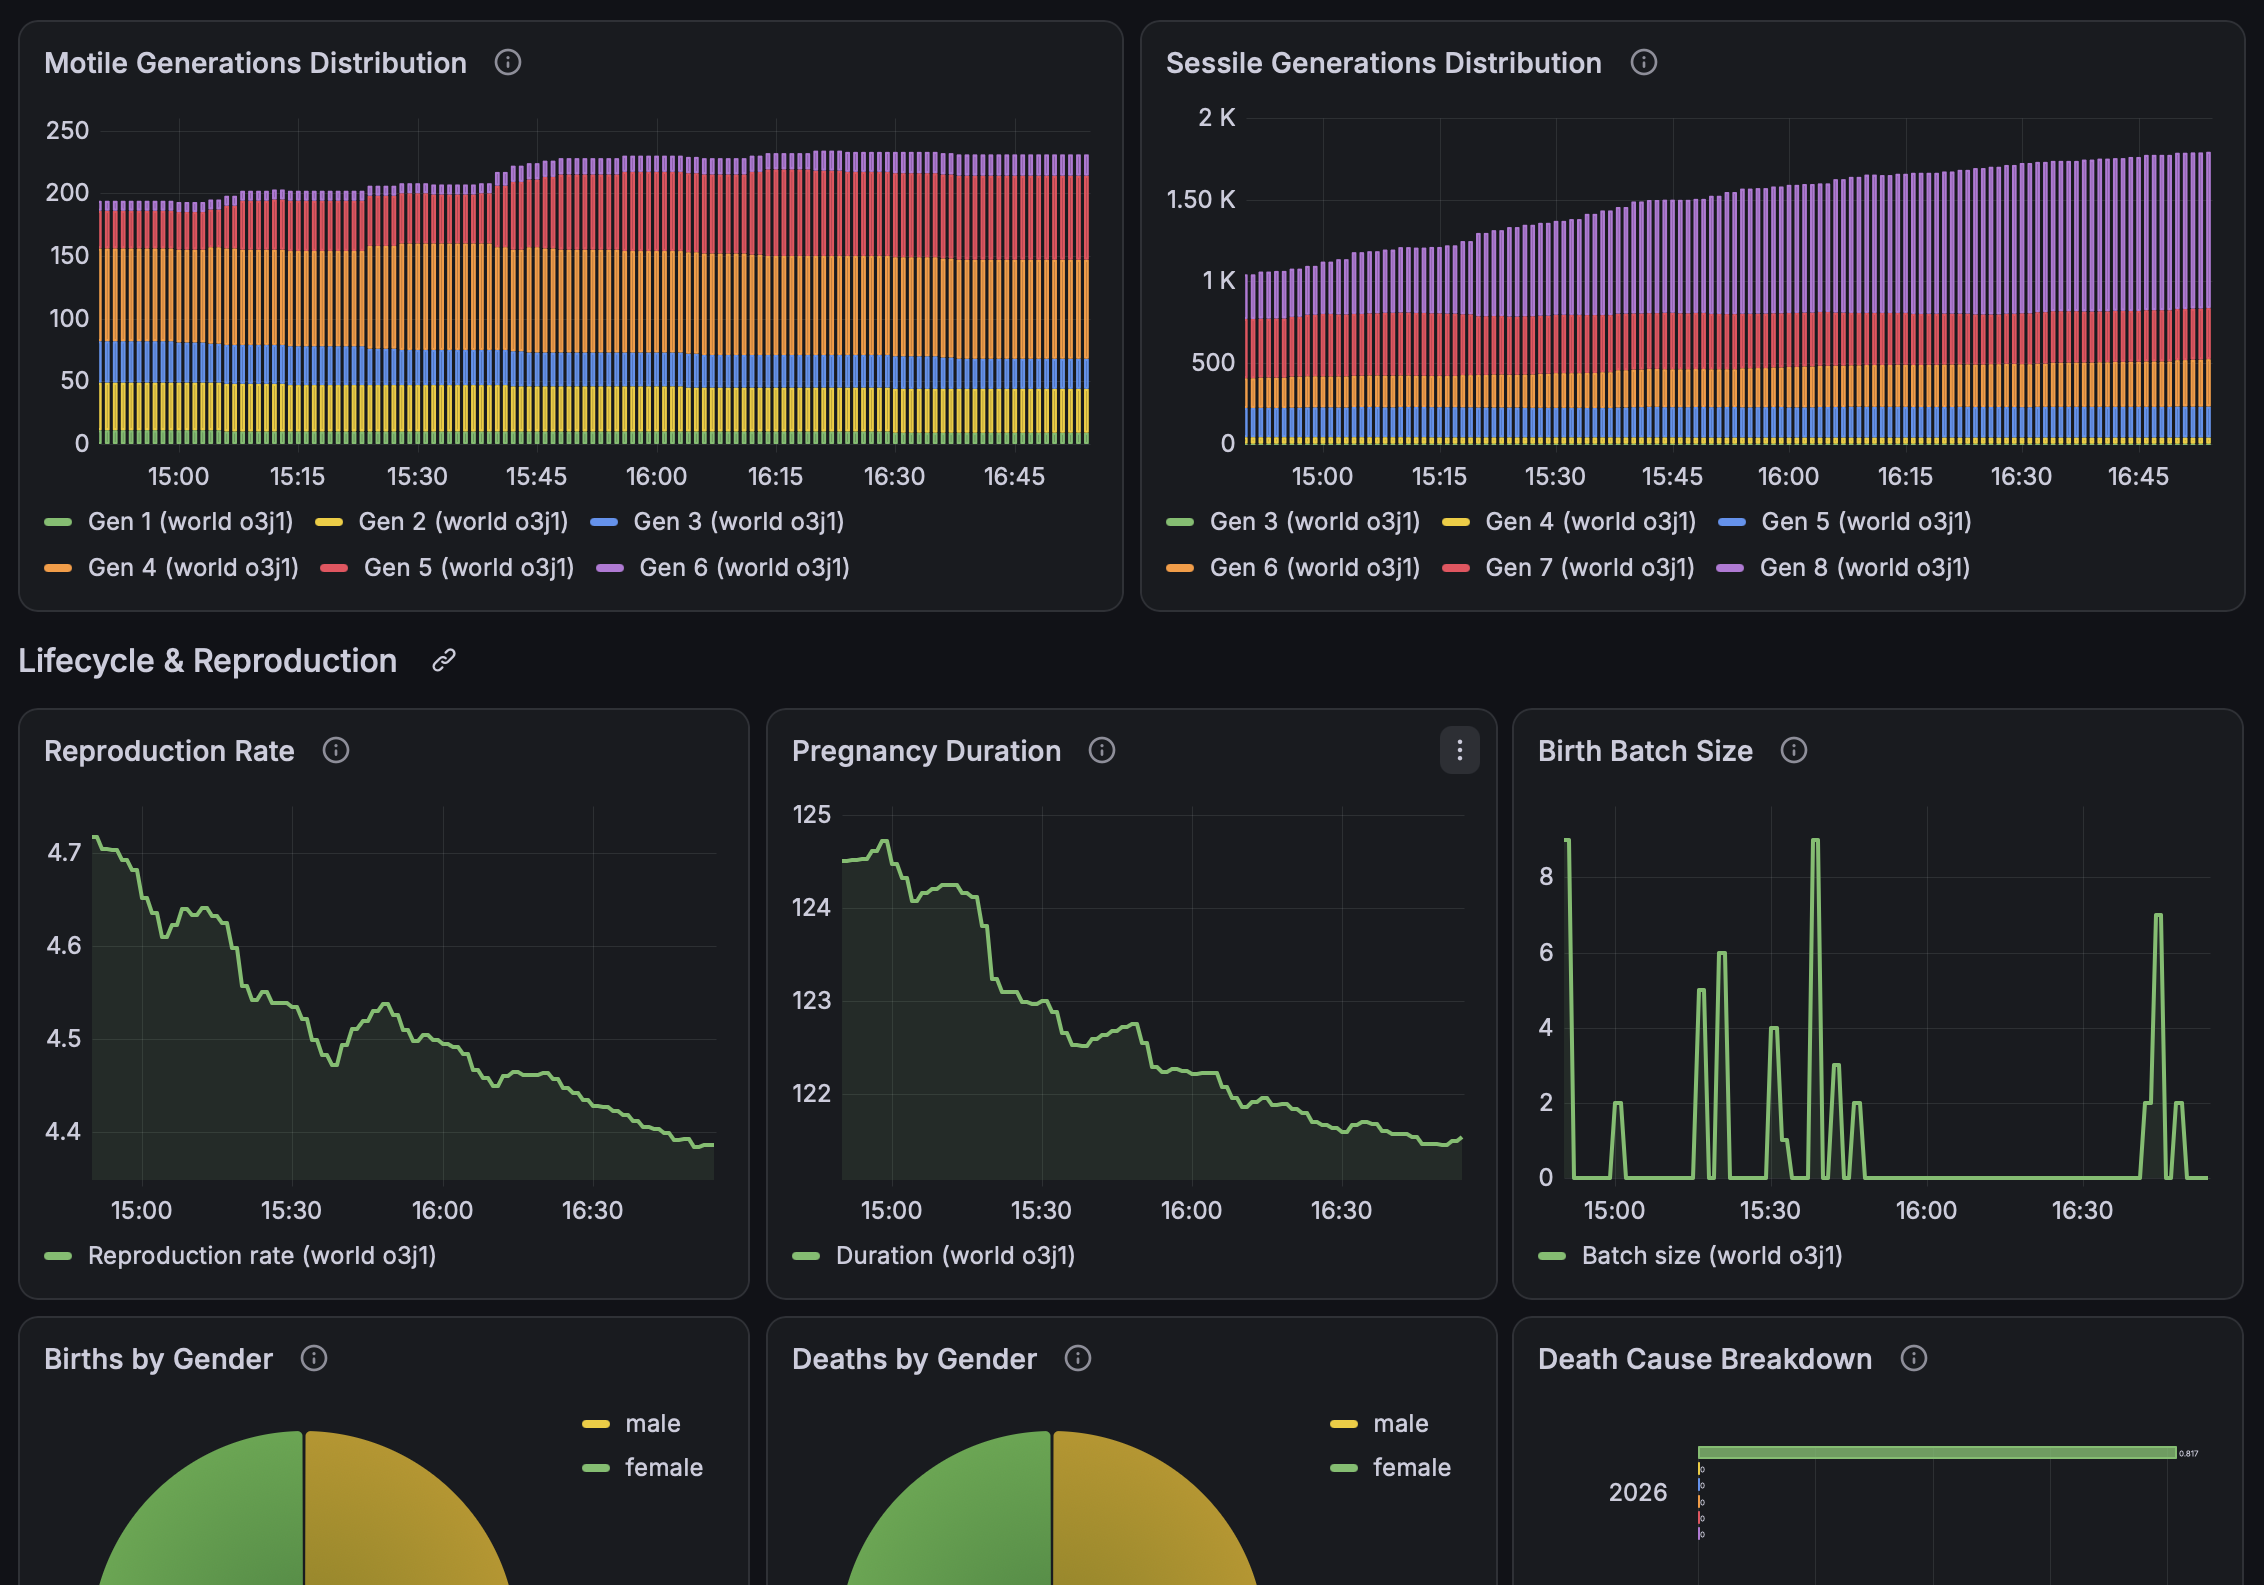
Grafana Cloud's free tier scrapes the api endpoint o man interval. On the Grafana side, I provisioned dashboards using Terraform, keeping dashboard definitions close to the code - server health (iteration rate, uptime, cache performance), simulation behavior (population dynamics, births and deaths by gender, species distribution, lifespan averages), and user metrics (entity interactions, controlled actions, active sessions).
The CORS dead end
The original plan was simple: point the browser directly at a public Grafana dashboard and pull stats from there. No server involvement needed for the client.
It didn't work. Grafana's public dashboard panel-query API does not set CORS headers on successful responses, and returns 401 on preflight OPTIONS requests. It works fine in curl but is completely unusable from a browser on a different origin. There is no configuration to fix this - it is a limitation of the public dashboard feature itself.
The authenticated proxy
With the browser ruled out as a direct Grafana consumer, I added same-origin proxy routes on the Rust server. Routes call Grafana Cloud's authenticated api , execute PromQL queries against the scraped metrics, and relay the results back to the browser as JSON.
What changed for the client
The UI looks the same. The home page ticker still cycles through population counts, birth rates, dominant species. The in-simulation overlays still show scoped and global statistics. The client code was rewritten to poll HTTP endpoints instead of holding a WebSocket connection, but the data it displays and the way it displays it did not change.
What changed is what's behind it. The numbers are now backed by a real time-series database with configurable retention. The server does less work - aggregation and history are Grafana's problem now. Adding a new metric means adding a gauge or counter on the server side; Grafana picks it up on the next scrape and it's immediately queryable in dashboards and in the proxy queries.
The result
The old stats tracker, the serializer, telemetry, the WebSocket endpoint - all gone. In their place: ~30 atomic metric writes per tick, a text-format scrape endpoint, and Grafana dashboards. The server is lighter. The data is richer. And I can finally see what happens in a world that runs for a week, not just what's happening right now.
See the live simulation metrics here.